Scales of Liveability KPIs
Methodology
Assessing a city's liveability levels is crucial for identifying
areas that require improvement and facilitating the implementation
of mobility innovations. Our approach involves the use of a comprehensive
survey that captures multiple aspects of quality of life, mobility
connectivity, and sustainability.
Our survey consists of 22 questions that are designed to measure the city's liveability levels across a
range of factors, including transportation, safety, housing, and
access to public services. To ensure that the survey responses are
consistent and can be analyzed easily, we have based the answer scale
of each question on numerical ranges. We calculated these ranges based
on the data collected at the beginning of the project, and then divided
the data distribution of each question into five bins and selected the
ranges for each answer.
- Lower than the 5TH quantile,
- Between the 5TH and the 35TH quantiles,
- Between the 35TH and the 65TH quantiles,
- Between the 65TH and the 95TH quantiles,
- Greater than the 95TH quantile
This approach ensures that the responses are standardized and can be analyzed effectively.
Example:
Taking as an example the KPI named “Average commuting time to work”, it quantifies the average time a citizen needs to move to their workplace.
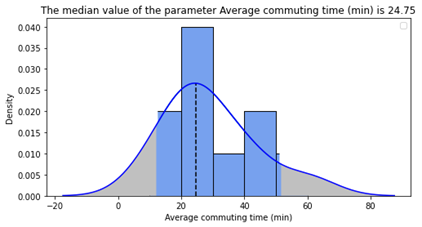
The observed commuting time from 10 cities was used; the median value was calculated at about 25 mins, the 5TH percentile is about 12 mins and the 95TH percentile is about 41 mins. Thus, assuming a city claims that its average commuting time to work is 10 minutes, the third question will be assigned with a value/score of 1 based on the aforementioned quantiles. The following figure represents the histogram of this variable, blue bars are the observations and grey areas are the outliers.
Following see the table with the data range of each question.
| Questions |
SUMI |
5TH |
35TH |
65TH |
95TH |
Unit |
|---|---|---|---|---|---|---|
| Q1 |
07 |
685 |
901 |
2261 |
7264 |
Kg CO²/inhs |
| Q2 |
03 |
16.15 |
24.62 |
27.54 |
45.68 |
µg/m³ |
| Q3 |
16 |
12.25 |
23.23 |
24.93 |
40.60 |
mins |
| Q4 |
17 |
19.41 |
44.30 |
68.41 |
90.08 |
m²/capita |
| Q5 |
44% |
68% |
100% |
100% |
% |
|
| Q6 |
01 |
2% |
3% |
4% |
40% |
% |
| Q7 |
5% |
9% |
16% |
49% |
% |
|
| Q8 |
5% |
8% |
13% |
61% |
% |
|
| Q9 |
11 |
0.26 |
1.14 |
2.30 |
8.29 |
vehs/1000 inhs |
| Q10 |
11 |
0.32 |
0.43 |
0.60 |
0.79 |
vehs/1000 inhs |
| Q11 |
0.00 |
8.58 |
17.60 |
22.38 |
tr/1000 inhs |
|
| Q12 |
1.35 |
2.63 |
2.94 |
20.70 |
- |
|
| Q13 |
06 |
6.53 |
12.29 |
13.64 |
33.82 |
- |
| Q14 |
10 |
3% |
10% |
16% |
46% |
% |
| Q15 |
02 |
0.60% |
1.10% |
9% |
25% |
% |
| Q16 |
12% |
37% |
61% |
88% |
% |
|
| Q17 |
0.08 |
0.19 |
0.30 |
4.25 |
- |
|
| Q18 |
08 |
0.11 |
0.41 |
0.80 |
1.45 |
vehs/1000 inhs |
| Q19 |
08 |
0.01 |
0.04 |
0.22 |
0.35 |
vehs/1000 inhs |
| Q20 |
30% |
50% |
75% |
95% |
% |
|
| Q21 |
12 |
2% |
17% |
27% |
50% |
% |
| Q22 |
2% |
8% |
15% |
49% |
% |